Types of LOD expressions
There are three types of LOD expressions you can create in Tableau:
- FIXED
- INCLUDE
- EXCLUDE
You can also scope an LOD expression to the table. This is called a Table-Scoped LOD expression.
FIXED
FIXED level of detail expressions compute a value using the specified dimensions, without reference to the dimensions in the view.
Example
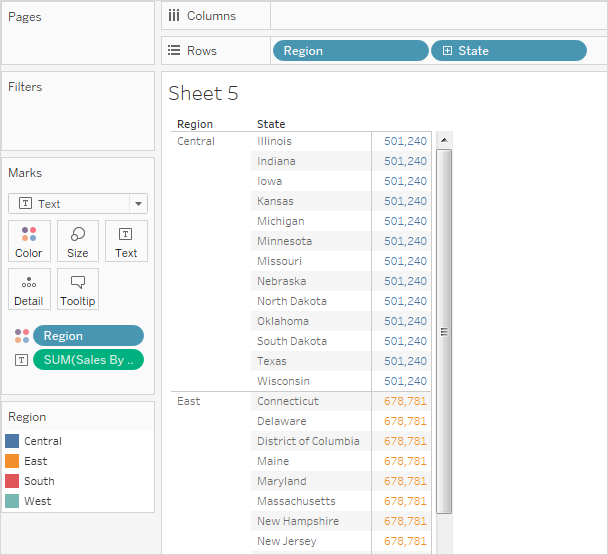
The following FIXED level of detail expression computes the sum of sales per region:
{FIXED [Region] : SUM([Sales])}
This level of detail expression, named [Sales by Region], is then placed on Text to show total sales per region.
The view level of detail is [Region] plus [State], but because FIXED level of detail expressions do not consider the view level of detail, the calculation only uses the dimension referenced in the calculation, which in this case is Region. Because of this, you can see that the values for the individual states in each region are identical. For more information about why this happens, see Aggregation and Level of Detail Expressions.
 If the INCLUDE keyword had been used in the level of detail expression instead of FIXED, the values would be different for each state, because Tableau would add the dimension in the expression ([Region]) with any additional dimensions in the view ([State]) when determining values for the expression. The result would be as follows:

{FIXED [Region] : SUM([Sales])}INCLUDE
INCLUDE level of detail expressions compute values using the specified dimensions in addition to whatever dimensions are in the view.
INCLUDE level of detail expressions can be useful when you want to calculate at a fine level of detail in the database and then re-aggregate and show at a coarser level of detail in your view. Fields based on INCLUDE level of detail expressions will change as you add or remove dimensions from the view.
Example 1
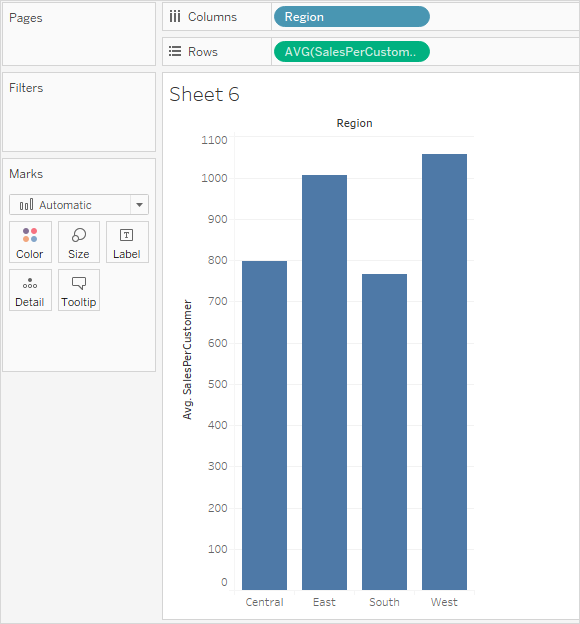
The following INCLUDE level of detail expression computes total sales per customer:
{ INCLUDE [Customer Name] : SUM([Sales]) }
When that calculation is placed on the Rows shelf, aggregated as AVG, and the [Region] dimension is placed on the Columns shelf, the view shows the average customer sales amount per region:
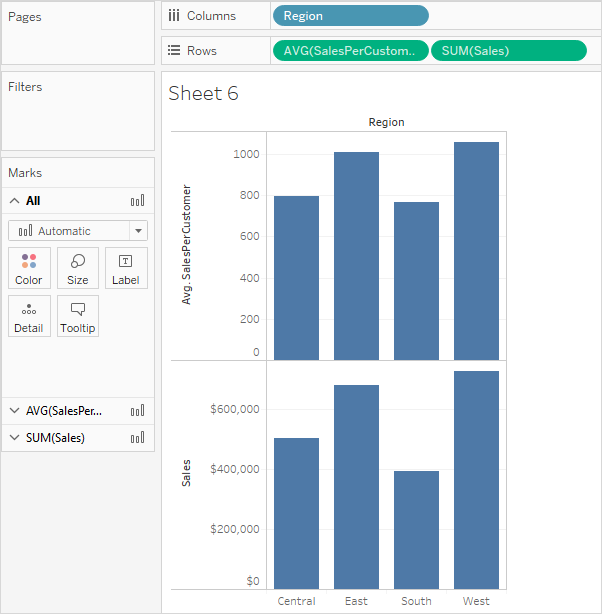
 If the [Sales] measure is then dragged to the Rows shelf, the result illustrates the difference between the total sale for each region and the average sale per customer for each region:
{ INCLUDE [Customer Name] : SUM([Sales]) }Example 2
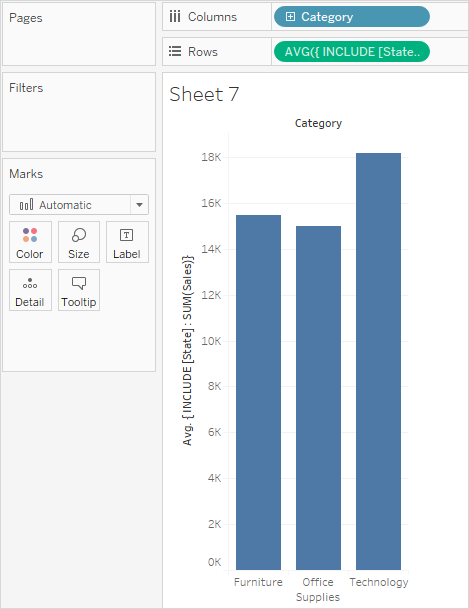
The following INCLUDE level of detail expression calculates sum of sales on a per-state basis:
{ INCLUDE [State] : SUM(Sales)}
The calculation is placed on the Rows shelf and is aggregated as an average. The resulting visualization averages the sum of sales by state across categories.
 When Segment is added to the Columns shelf and the calculation is moved to Label, the LOD expression results update. Now you can see how the average sum of sales per state varies across categories and segments.

{ INCLUDE [State] : SUM(Sales)}EXCLUDE
EXCLUDE level of detail expressions declare dimensions to omit from the view level of detail.
EXCLUDE level of detail expressions are useful for ‘percent of total’ or ‘difference from overall average’ scenarios. They are comparable to such features as Totals and Reference Lines.
EXCLUDE level of detail expression cannot be used in row-level expressions (where there are no dimensions to omit), but can be used to modify either a view level calculation or anything in between (that is, you can use an EXCLUDE calculation to remove dimension from some other level of detail expression).
Example 1
The following EXCLUDE level of detail expression computes the average sales total per month and then excludes the month component:
{EXCLUDE [Order Date (Month / Year)] : AVG({FIXED [Order Date (Month / Year)] : SUM([Sales])})}
For more information on creating Month / Year date fields, see Custom Dates.
Notice that this is a nested level of detail expression—that is, a level of detail expression within another level of detail expression.
Saved as [average of sales by month], the calculation can then be subtracted from the sum of sales per month by means of an ad-hoc calculation on the Rows shelf:
 With Month([Order Date]) on the Columns shelf, this creates a view that shows the difference between actual sales per month over a four-year period and the average monthly sales for the entire four-year period:

{EXCLUDE [Order Date (Month / Year)] : AVG({FIXED [Order Date (Month / Year)] : SUM([Sales])})}Example 2
The following level of detail expression excludes [Region] from a calculation of the sum of [Sales]:
{EXCLUDE [Region]: SUM([Sales])}
The expression is saved as [ExcludeRegion].
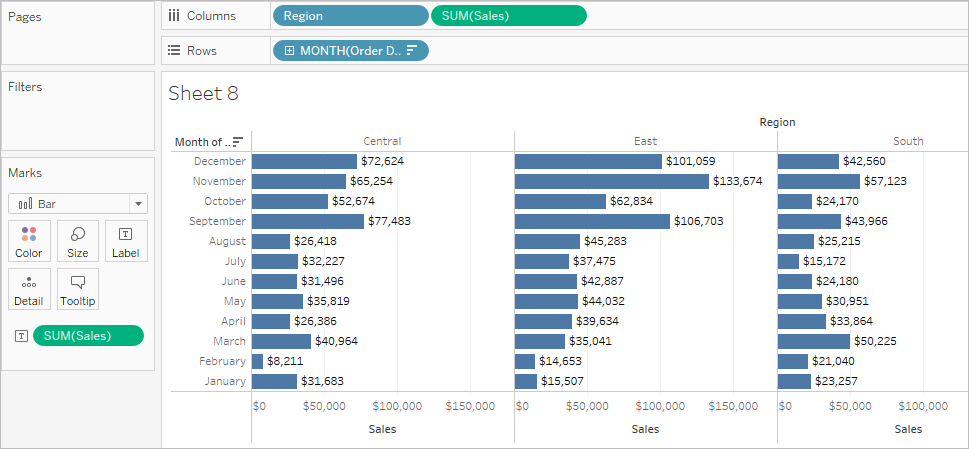
To illustrate how this expression might be useful, first consider the following view, which breaks out the sum of sales by region and by month:
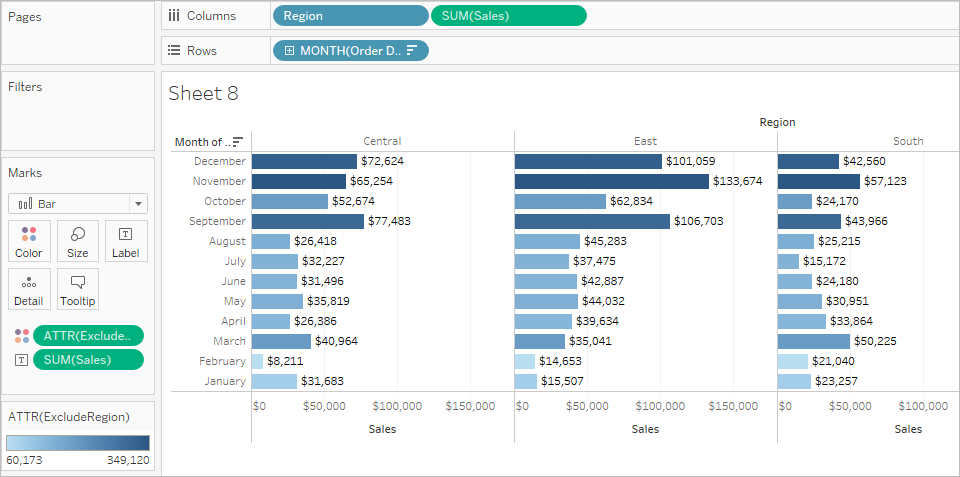
 Dropping [ExcludeRegion] on Color shades the view to show total sales by month but without the regional component:
{EXCLUDE [Region]: SUM([Sales])}Table-Scoped
It is possible to define a level of detail expression at the table level without using any of the scoping keywords. For example, the following expression returns the minimum (earliest) order date for the entire table:
{MIN([Order Date])}
This is equivalent to a FIXED level of detail expression with no dimension declaration:
{FIXED : MIN([Order Date])}
{MIN([Order Date])}{FIXED : MIN([Order Date])}LOD expression syntax
A level of detail expression has the following structure:
{[FIXED | INCLUDE | EXCLUDE] <dimension declaration > : <aggregate expression>}
The elements in a level of detail expression are described in the following table.
| Element | Description |
| { } | The entire level of detail expression is enclosed in curly braces. |
| [FIXED | INCLUDE | EXCLUDE] |
The first element after the opening curly brace is one of the following scoping keywords:
|
| <dimension declaration> |
Specifies one or more dimensions to which the aggregate expression is to be joined. Use commas to separate dimensions. For example:
[Segment], [Category], [Region]
For level of detail expressions, you can use any expression that evaluates as dimension in a dimensionality declaration, including Date expressions.
This example will aggregate the sum of Sales at the Year level:
{FIXED YEAR([Order Date]) : SUM(Sales)}
This example will aggregate the sum of Sales for the [Order Date] dimension, truncated to the day date part. Because it is an INCLUDE expression, it will also use the dimensions in the view to aggregate the value:
{INCLUDE DATETRUNC('day', [Order Date]) : AVG(Profit)}
Note: It is strongly recommended that you drag fields into the calculation editor when creating dimension declarations, instead of typing them. For example, if you see YEAR([Order Date]) on a shelf and then type that as the dimension declaration, it will not match the field on the shelf. But if you drag the field from the shelf into the expression, it will become DATEPART('year', [Order Date]), and that will match the field on the shelf.
With named calculations (that is, calculations that you save to the Data pane, as opposed to ad-hoc calculations, which you do not name), Tableau cannot match the name of a calculation to its definition. So if you create a named calculation, MyCalculation, defined as follows:
MyCalculation = YEAR([Order Date])
And then you created the following EXCLUDE level of detail expression and used it in the view:
{EXCLUDE YEAR([Order Date]) : SUM(Sales)}
Then MyCalculation would not be excluded.
Similarly, if the EXCLUDE expression specified MyCalculation:
{EXCLUDE MyCalculation : SUM(Sales)}
Then YEAR([Order Date]) would not be excluded.
|
| : | A colon separates the dimension declaration from the aggregate expression. |
| <aggregate expression> | The aggregate expression is the calculation performed to define the target dimensionality. |
Comments
Post a Comment